

Linux has no dearth in utilities which aid a user in getting a snapshot of the network traffic which course through ones machine especially when one is connected to the internet. Some of them which come to my mind are the ubiquitous 'tcpdump' and 'ethereal'. tcpdump is installed by default by any GNU/Linux distribution. But many others need to be specifically downloaded and installed by the user in order to use them.
One such software which aids the user in keeping an eye on the exchange of IP packets to and from ones machine is IPTraf. This is a curses based menu driven utility which intercepts packets on the network and gives out information about it. Usually, such network monitoring software are run on gateways where the computer acts as a router to the outside world. But it can also be used by a home user who is connected to the net to monitor the going ons in ones machine.
To start using IPTraf, one has to first install it; which on a debian system is as simple as executing the command:
# apt-get install iptrafOnce the software is installed, one can start it to monitor the network. Unfortunately, you should have root privileges to run the software. In ubuntu, it means inserting the word 'sudo' before the command as follows:
$ sudo iptrafOnce the above command is executed, the user is shown a curses based menu where one can choose to start monitoring either the local interface or the traffic through any of the network cards installed on ones machine.
 Fig: iptraf Configuration Menu
I found this network monitoring software really useful and an eye opener at the same time. For instance, I have disabled almost all the services on my machine. But I found that within just 15 minutes of getting online, IPTraf logged at least 6 attempts at connecting to my machine via SSH. Of course they could have been the result of a probe by someone using nmap to see which all ports were open on my machine. So much for obscurity while on the net.
Also this easy to use software has additional options such as enabling reverse DNS lookup in the options menu in which case, the logs will contain the DNS name instead of the IP address where ever possible and the service name instead of the port number. For example, when some traffic is generated when I connect to the yahoo.com website from my web browser, iptraf will show it as yahoo.com:www which denotes that I am connecting to the port 80 of yahoo website. It will also give a count of the number of packets transferred to and from the yahoo web server to my machine all in real time.
Same is the case with when someone tries to probe ones machine. Each and every IP packet is intercepted, the IP information of each packet decoded and the result displayed in real time. There is option to save the logs to a file which by default resides in the /var/log/iptraf directory. Even though I found it most useful for monitoring my ethernet traffic, that is not all that this nifty tool monitors. It can additionally monitor ppp, loopback, SLIP, FDDI, and ISDN interfaces.
 Fig: Iptraf monitoring the eth0 device on my machine
Some of the information of the intercepted packets that is decoded by iptraf are as follows:
- Source address and port
- Destination address and port
- Packet count
- Byte count
- Packet size
- Window count and
- Flag status
I would like to dwell a bit on the flag status shown by iptraf. Each TCP packet that is intercepted is associated one or more flags which convey some information like which side had initiated the connection, when the connection is closed and so on. The flags are as follows :
- S - A SYN (or synchronisation) is taking place in preparation for connection establishment. If only an S--- is present, then the source is trying to establish a connection. But if there is an S-A- then this is an acknowledgement of a previous connection request.
- A - Acknowledgement of a previously received packet
- P - A request to push all the data to the top of the receiving queue.
- U - The packet contains urgent data
- RESET - The source machine indicated in this direction reset the entire connection.
- DONE - The connection is done sending data in this direction and has sent a FIN (finished) packet but has not yet been acknowledged by the other host.
- CLOSED - The FIN has been acknowledged by the other host.
- - - A dash indicates the flag is not set.
So if I see any unusual SYN activity (S---) , then I can fairy assume that my machine is under a SYN attack.
IPTraf can display a statistical breakdown of the network packets sorted by the packet size or according to the TCP/UDP port which gives a fair idea of the network traffic to and from ones machine.
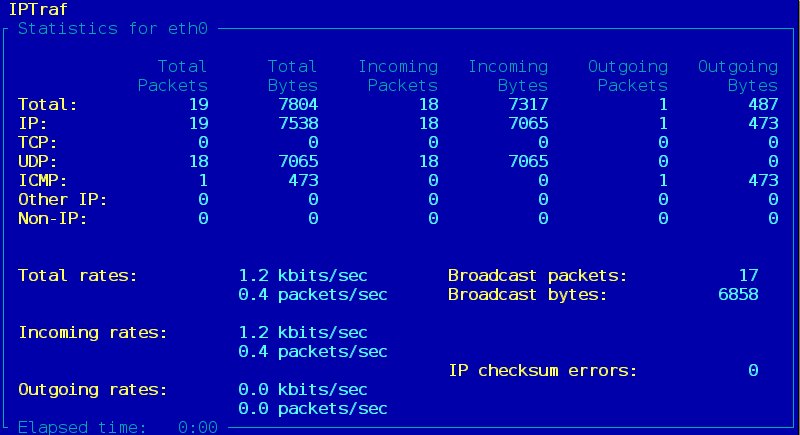 Fig: Statistical breakdown of network packets
Iptraf also supports a rich set of command line options which makes it ideal for use from within a script. True, you have an even powerful network monitor in ethereal but in my opinion, iptraf provides a right balance of functionality and simplicity which makes it an ideal tool for home users who want to monitor their network.
No comments:
Post a Comment